
Digital marketing and brand strategy present significant challenges for marketers and strategists amid evolving trends and consumer behaviors. Success depends on reaching the right audience with relevant content and cost optimization. However, not all brands have extensive data access to inform their decisions. This is where synthetic data generation plays a crucial role, augmenting limited samples and extracting valuable insights.
The Role of Data in Digital Marketing
Data empowers digital marketing, enabling brands to make data-driven decisions and optimize strategies. Yet, collecting detailed data in fast-changing contexts poses challenges. Because marketers often work with small or medium-sized datasets lacking statistical significance, hindering accurate campaign success forecasting and advertising spending saturation point determination.
Tabular Synthetic Data: Unlocking its Potential
While synthetic data generation gains attention in image and text fields, its application to tabular data is often overlooked. Tabular synthetic data, structured with rows and columns, holds immense potential for digital marketers and strategists. Leveraging generative adversarial networks (GANs), a cutting-edge machine learning technology, synthetic data expands datasets and enhances “resolution,” revealing additional insights.
Generative Adversarial Networks (GANs): Empowering Synthetic Data Generation
GANs are a powerful machine learning innovation involving two neural networks, a generator, and a discriminator, competing against each other. The generator creates new data samples statistically similar to input data, while the discriminator distinguishes real from synthetic samples. This adversarial game drives training, generating high-quality synthetic data resembling the original dataset.
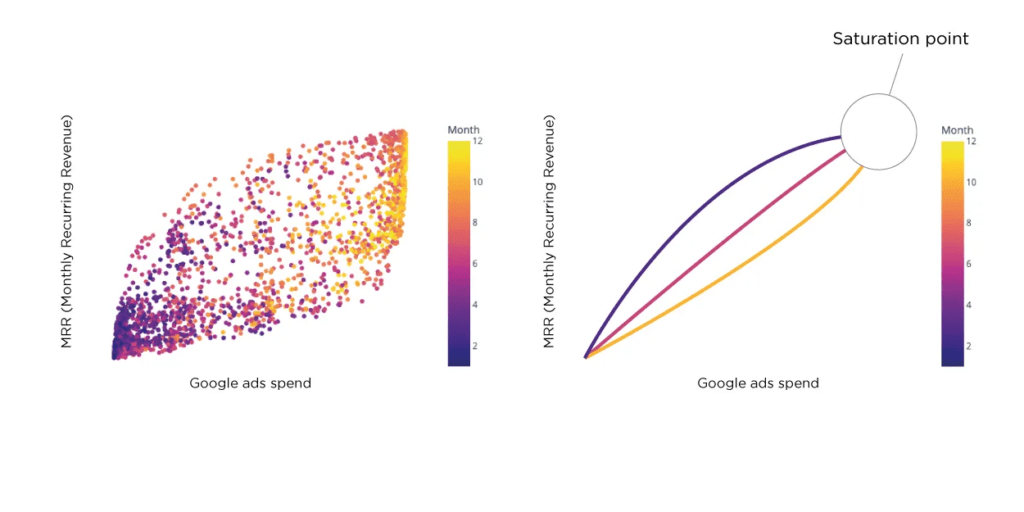
Understanding the Saturation Point in Digital Marketing
The saturation point is bottom-line in digital marketing, preventing diminishing returns from excessive advertising spending. The advertising S-curve illustrates the relationship between spend and its impact on sales, revenue, or market share. Beyond a certain point, increasing spending fails to yield proportional returns. Estimating the saturation point accurately is challenging, especially with limited data. Synthetic data addresses this by providing a larger dataset for analysis and enabling more precise predictions.
A Practical Use Case: Leveraging Synthetic Data
Let’s consider a novel brand launched two years ago, running various advertising campaigns across platforms with limited data. Determining if they reached the saturation point and planning next strategic steps are vital. Generating a synthetic dataset from the original data expands the sample size and offers insights into the saturation point and other key metrics.
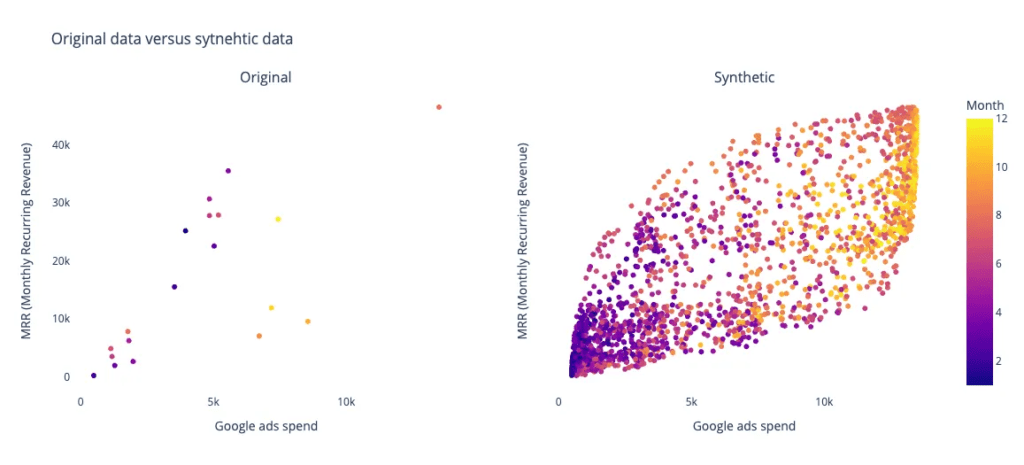
Using the open-source Python library nbsynthetic by NextBrain.ai team, synthetic data is generated from the original dataset. A 2000-sample synthetic dataset is created, and a visual comparison between the original and synthetic data is made. Additionally, a machine learning model, like a Random Forest Regressor, is trained on both datasets to predict key metrics such as Monthly Recurring Revenue (MRR). The results (figures below) show that the synthetic data-trained model achieves greater stability and improved prediction accuracy compared to the model trained on the original low sample size data.
╔═══════════════╗
     RESULTS
╚═══════════════╝

Original data
-------------
Score without cross validation = 0.32
Scores with cross validation = [ 0.19254948 -7.0973158   0.1455913   0.18710539 -0.14113018]

Synthetic data
--------------
Score without cross validation = 0.80
Scores with cross validation = [0.8009446  0.81271862 0.79139598 0.81252436 0.83137774]

Algorithm trained with synthetic data and tested with original data
-------------------------------------------------------------------
Score with cross validation prediction = 0.71
This post was originally published in Towards Data Science. You can find the original one here.

 +34 910 054 348
 +44 (0) 7903 493 317