No-code AutoML tools benchmark
NextBrain is the leading No-code AutoML platform on the market, and for good reason. We’ve put our platform to the test against our competitors, using the same dataset and default training conditions for each.
The results speak for themselves – NextBrain consistently outperforms the competition in terms of model accuracy, training time, and cost. We’re committed to providing our users with the best possible tools and resources to help them succeed, and our performance benchmarking is just one way we’re demonstrating our dedication to excellence.
Choose NextBrain betwen other tools (Azure Machine Learning, Amazon SageMaker, BigML) and experience the best in No-code AutoML performance.

Dataset
In our performance evaluations, we have chosen datasets with different number of rows and columns for binary classification, multi-class classification, and multivariate regression problems.
We also used special datasets with only a few rows and trained the models with synthetic data generated with NextBrain from original data samples.
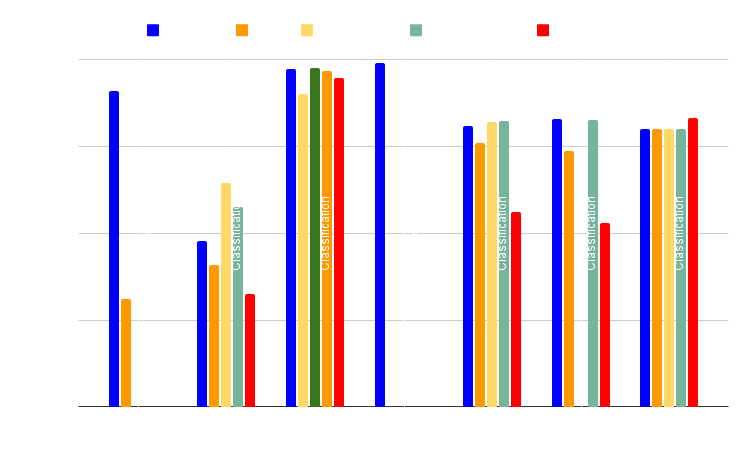
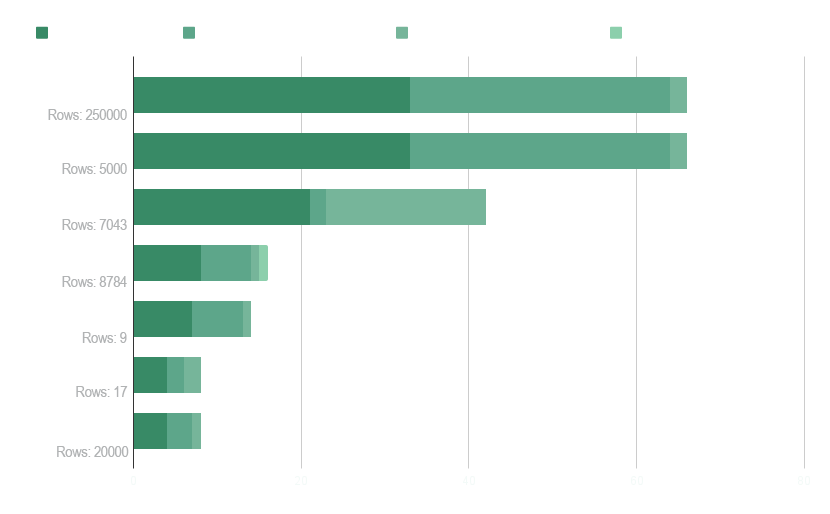
Accuracy Benchmark
In our performance evaluations, we have chosen datasets with different number of rows and columns for binary classification, multi-class classification, and multivariate regression problems.
We also used special datasets with only a few rows and trained the models with synthetic data generated with NextBrain from original data samples.
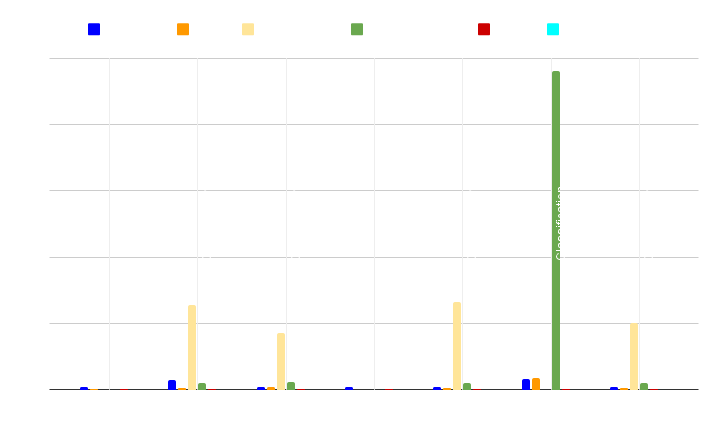
Training Time Benchamark
In our performance evaluations, we have chosen datasets with different number of rows and columns for binary classification, multi-class classification, and multivariate regression problems.
We also used special datasets with only a few rows and trained the models with synthetic data generated with NextBrain from original data samples.
Features comparison

- End-to-end tool: The tool provider handles all software and hardware needs, including installation, integration, and setup.
- Web app: There is no need to download or install this tool because it is available as a web application.
- Spreadsheet plugin: The application is available as a Google Sheets Ad-on available in GS market place.
- Deployment in user server: Web application can be copied in a user defined server to fulfill security requirements.
- API services / SDK: API services enable users to have access to the tool’s functionality and data. Users benefit from their flexibility, integration, innovation, and collaboration.
- Databases connector: A SQL database connector allows integration and manipulation of a SQL database from other systems and applications, and provides performance, scalability, security, and ease of use benefits.
- Marketing API (Dataslayer.ai): Connector to Dataslayer.ai where more than 40 available connectors for marketing data.
- Auto data preparation: Application does both basic and advanced data preparation and feature engineering before training a model to get more reliable insights.
- Synthetic data generation: Generation of synthetic data to get larger sample datasets and improve the quality of the models. Also is useful for data anonymization.
- Customizable models: Options like algorithm to use and its fine tuning are available as advanced options.
- Interactive dashboards: Tool for visualizing and sharing data and machine learning models insights.
Dataset we use
ROI – Download
The return on investment (ROI) is a key metric that is used to evaluate the effectiveness of a marketing campaign. It is calculated by dividing the net profit that a campaign generates by the total cost of the campaign, and is usually expressed as a percentage. ROI is considered to be an important metric for marketing campaigns because it provides a way to measure the profitability of a campaign and compare it to other campaigns or investments. This can help marketers to determine which campaigns are the most effective and where to allocate their resources in the future. In addition, ROI is important because it helps to align marketing efforts with business objectives. By focusing on campaigns that generate a high ROI, marketers can ensure that their efforts are contributing to the overall financial success of the business. This is especially important in today’s business environment, where companies are under increasing pressure to demonstrate the value of their marketing spend.
![]() Target: MRR (Monthly Recurring Revenue)
Target: MRR (Monthly Recurring Revenue)
 Data Source: Dataslayer.ai
 License: Data files © Dataslayer.ai
Forest LiDAR – Download
Light detection and ranging (LIDAR) technology have became an essential tool for environmental preservation. Lidar is a technology that uses a laser to target an object or a surface and time the return of the reflected light to the receiver. It can be used, for example, to generate computerized 3-D representations of areas on the Earth’s surface. As a result, ecologists and biologists have found the best partner in this technology for detection, classification, and conservation activities. However, this technology requires significant computational resources to process the millions of points obtained for a single square meter of analysis. All of these points must be classified and segmented, and there are various mathematical and computational methodologies that can be used to process all of this data and produce readable and interpretable results. This dataset contains a LIDAR representation of three trees. Every point is represented by its X, Y and Z coordinates. So dataset has only three input variables (x,y,z) and a target (Tree).
![]() Target: Tree
Target: Tree
Data Source: CIFOR and Wageningen University
License: Data files © CIFOR and Wageningen University
Reference:
Gonzalez de Tanago, J, Lau, A, Bartholomeus, H, et al. (2018). Estimation of above‐ ground biomass of large tropical trees with terrestrial LiDAR. Methods Ecol Evol. 9: 223– 234. https://doi.org/10.1111/2041-210X.12904
Higgs Boson – Download
This dataset contains a benchmark task for machine-learning classification algorithms that is designed to distinguish between a signal process where new theoretical Higgs bosons are produced, and a background process with the identical decay products but distinct kinematic features (Baldi P. et al, 2014). The dataset contains the following columns: the target columns (“Label”) is the class label (1 for signal, 0 for background). There are 28 features (21 low-level features then 7 high-level features): lepton pT, lepton eta, lepton phi, missing energy magnitude, missing energy phi, jet 1 pt, jet 1 eta, jet 1 phi, jet 1 b-tag, jet 2 pt, jet 2 eta, jet 2 phi, jet 2 b-tag, jet 3 pt, jet 3 eta, jet 3 phi, jet 3 b-tag, jet 4 pt, jet 4 eta, jet 4 phi, jet 4 b-tag, m_jj, m_jjj, m_lv, m_jlv, m_bb, m_wbb, m_wwbb. The detailed description of this columns can be found in Baldi P. et al. 2014.
![]() Target: Label
Target: Label
Data source: https://archive.ics.uci.edu/ml/datasets/higgs
License: Data files © Daniel Whiteson
Reference:
Baldi, P., Sadowski, P., & Whiteson, D. (2014). Searching for exotic particles in high-energy physics with deep learning. Nature communications, 5(1), 1-9.
Physics universal laws – Download
Machine learning algorithms are currently being used to automate the discovery of physics principles and governing equations based on data rather than in solving complex equations systems. By addressing the classic problem of modeling falling objects of different sizes and masses, we can identify a number of difficult issues that must be managed by recent data-driven methods for automated physics discovery. We aim to address the classic problem of modeling falling objects of different sizes and masses for automated physics discovery. Theoretical research into fluid forces on an idealized sphere has resulted in an extensive history of scientific research. Aside from gravity and drag, a ball’s trajectory can be modified by its spin via the Magnus force or lift force, which works orthogonally to the drag. Other variables that may affect the forces produced by a falling ball include air temperature, wind, elevation, and ball surface shape (de Silva et al. 2020). The dataset source is the article “Discovery of Physics From Data: Universal Laws and Discrepancies (de Silva et al. 2020). The data set includes observations for nine different types of balls: a golf ball, a baseball, a tennis ball, a blue basketball, a green basketball, a whiff ball, a yellow whiffle ball, and an orange whiffle ball.
![]() Target: Landing time
Target: Landing time
Data Source: https://www.frontiersin.org/files/Articles/479363/frai-03-00025-HTML/image_m/frai-03-00025-t001.jpg
License: Data © Silva, B. M., Higdon, D. M., Brunton, S. L., Kutz, J. N
Reference:
de Silva, B. M., Higdon, D. M., Brunton, S. L., & Kutz, J. N. (2020). Discovery of Physics From Data: Universal Laws and Discrepancies. Frontiers in artificial intelligence, 3, 25. https://doi.org/10.3389/frai.2020.00025
Telco Churn – Download
Customer churn, also known as customer attrition, refers to the percentage of customers who stop using a company’s products or services over a given period of time. It is an important metric for a telecom company to measure because customer churn can have significant financial implications. Telecom companies typically have high fixed costs, such as the cost of building and maintaining networks and infrastructure, and these costs need to be spread out over a large customer base in order to be financially viable. If the rate of customer churn is high, it can lead to a decline in the overall number of customers, which can make it more difficult for the company to cover its fixed costs. This can ultimately lead to a decline in profitability. By tracking the customer churn rate, a telecom company can identify trends and patterns in customer behavior, and take steps to improve retention and reduce the rate of churn. This could include offering more competitive pricing, improving customer service, or introducing new products and services that are more attractive to customers.
![]() Target: Churn
Target: Churn
Data Source: Dataset adapted from IBM Business Analytics Community (https://community.ibm.com/community/user/businessanalytics/blogs/steven-macko/2019/07/11/telco-customer-churn-1113).
License: Data files © IBM
Weather data – Download
Predicting the weather is important for communities for a variety of reasons. First and foremost, accurate weather forecasts can help people to stay safe by allowing them to prepare for extreme weather events, such as hurricanes, floods, and snowstorms. For example, if a community knows that a major storm is coming, they can take steps to secure their homes, evacuate if necessary, and stock up on supplies. In addition to safety concerns, accurate weather forecasts are also important for economic reasons. Many businesses and industries are affected by the weather, and they rely on accurate forecasts in order to plan their operations and make informed decisions. For example, farmers need to know what the weather will be like in order to decide when to plant and harvest their crops, and construction companies need to know if it will be hot or cold in order to plan their work schedules. Finally, accurate weather forecasts are important for everyday life. They allow people to plan their outdoor activities and make decisions about what to wear and how to travel. They can also have an impact on people’s moods and well-being, as bad weather can make people feel down or even affect their mental health.
![]() Target: Weather
Target: Weather
Data Source: Adapted from Historical Hourly Weather Data 2012-2017 (https://www.kaggle.com/datasets/selfishgene/historical-hourly-weather-data?select=pressure.csv).
License: This dataset is made available under the Open Database License: http://opendatacommons.org/licenses/odbl/1.0/. Any rights in individual contents of the database are licensed under the Database Contents License: http://opendatacommons.org/licenses/dbcl/1.0/

 +34 910 054 348
 +44 (0) 7903 493 317